How to remove outline or stroke from ChartSeriesMarkers in Telerik Chart?
|
ykl
342
Points
18
Posts
|
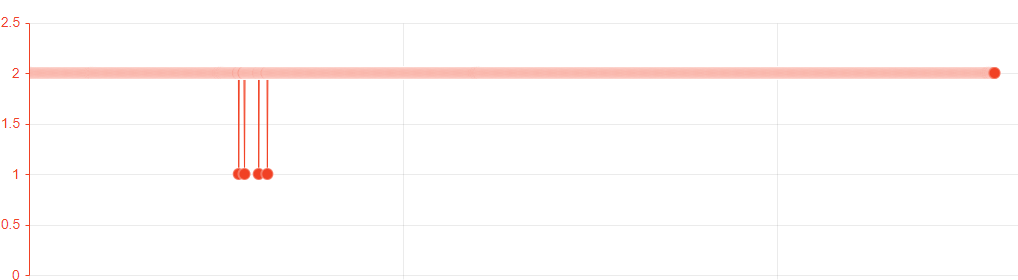
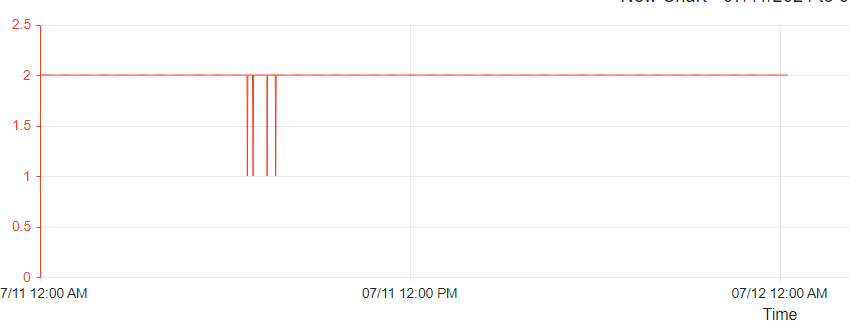
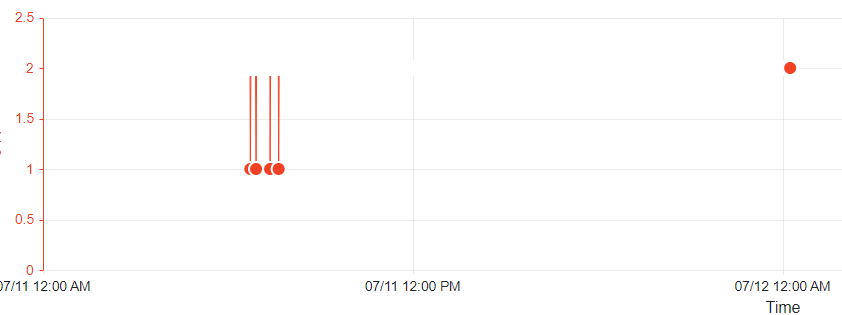
Guys, I'm trying to remove marker outline i.e. stroke in the Telerik Chart. But I'm not seeing any way to do this. Problem with outline (stroke): For the large point data and very near data, telerik chart is ploting data point as linear graph and looks good. But when do moveout on legend it's showing only last point other getting blank:
I tried to remove stroke by css: But I want to do this from chart control: Anyone has any idea?
Views:
594
Total Answered: 2 Total Marked As Answer: 1 Posted On: 11-Jul-2024 22:22 Share: 


|
Answers
|
beginer
1576
Points
53
Posts
|
Found somthing: https://docs.telerik.com/blazor-ui/knowledge-base/chart-transparent-marker we can add transparent marker. not sure if it will help something in your case.
Posted On:
12-Jul-2024 02:25
thanks. - ykl 12-Jul-2024 05:01
|
|
ykl
342
Points
18
Posts
|
|